
NCAA Women’s Basketball Tournament
The data this week comes from FiveThirtyEight. The original raw data is on their [GitHub]. More details about the NCAA Women’s Basketball Tournament which expended to 64 teams in 1994. There are some additional data points at that Wikipedia link if you’re curious!
Note that for their dataviz, they converted seed to a 100 point scale based off the average wins/seed. Note that FiveThirtyEight used Simple Rating System scores from Sports-Reference, but I’ve simplified it into simply the average per seed.
A quick table of this as seen below:

To measure this, we awarded “seed points” in proportion to a given seed number’s expected wins in the tournament, calibrated to a 100-point scale where the No. 1 seed gets 100 points, No. 2 gets 70 points, and so forth.
This aligns to (based off the averages):
| Seed | Points |
|---|---|
| 1st | 100 |
| 2nd | 72.7 |
| 3rd | 54.5 |
| 4th | 48.5 |
| 5th | 33.3 |
| 6th | 33.3 |
| 7th | 27.3 |
| 8th | 21.2 |
| 9th | 18.2 |
| 10th | 18.2 |
| 11th | 18.2 |
| 12th | 15.2 |
| 13th | 9.09 |
| 14th | 6.06 |
| 15th | 3.03 |
| 16th | 0 |
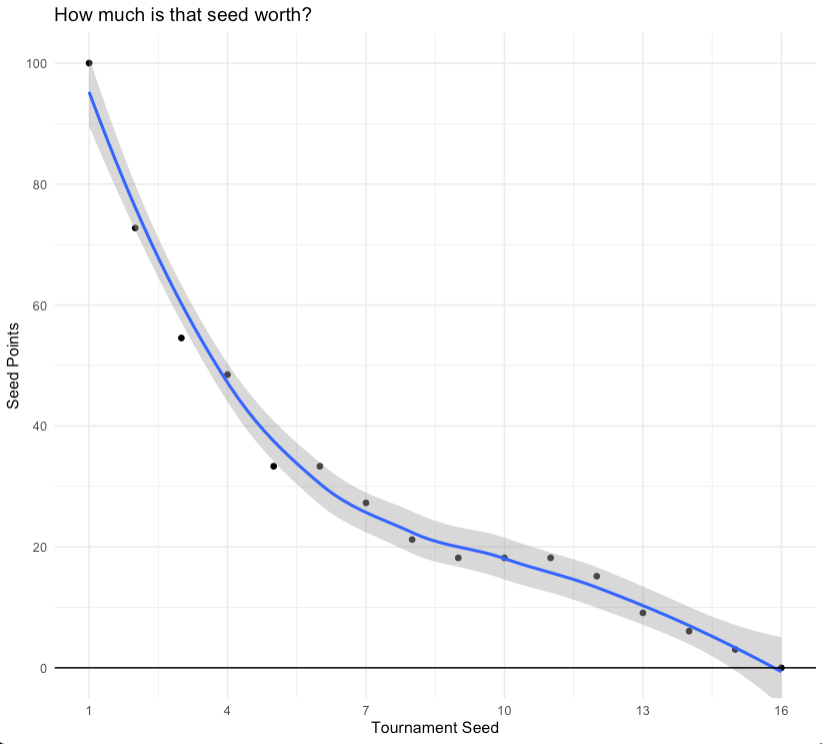
Their modeled fit:

You could see the quick plot of these points, but again note that this will vary a bit from the FiveThirtyEight table as they included SRS score in their equation.
tibble(
  seed = c(1:16),
  exp_wins = c(3.3, 2.4, 1.8, 1.6, 1.1, 1.1, 0.9, 0.7, 0.6, 0.6, 0.6, 0.5, 0.3, 0.2, 0.1, 0)

) %>%
  mutate(
    points = exp_wins/3.3 * 100
  ) %>%
  ggplot(aes(x = seed, y = points)) +
  geom_point() +
  geom_smooth() +
  geom_hline(yintercept = 0, color = "black") +
  scale_y_continuous(breaks = seq(0, 100, by = 20)) +
  coord_cartesian(ylim = c(0, 100)) +
  scale_x_continuous(breaks = seq(1, 16, by = 3)) +
  theme_minimal() +
  labs(
    x = "Tournament Seed", y = "Seed Points",
    title = "How much is that seed worth?"
  )
Thus, to get the points for each team/tournament season you can multiply the teams initial seed (1 - 16) by the assigned points as defined in the above table of 100 - 0.
Get the data here
# Get the Data

# Read in with tidytuesdayR package
# Install from CRAN via: install.packages("tidytuesdayR")
# This loads the readme and all the datasets for the week of interest

# Either ISO-8601 date or year/week works!

tuesdata <- tidytuesdayR::tt_load('2020-10-06')
tuesdata <- tidytuesdayR::tt_load(2020, week = 41)

tournament <- tuesdata$tournament

# Or read in the data manually

tournament <- readr::read_csv('https://raw.githubusercontent.com/rfordatascience/tidytuesday/main/data/2020/2020-10-06/tournament.csv')
Data Dictionary
Seed Point Value as defined in a separate FiveThirtyEight Article
| Seed | Points |
|---|---|
| 1st | 100 |
| 2nd | 72.7 |
| 3rd | 54.5 |
| 4th | 48.5 |
| 5th | 33.3 |
| 6th | 33.3 |
| 7th | 27.3 |
| 8th | 21.2 |
| 9th | 18.2 |
| 10th | 18.2 |
| 11th | 18.2 |
| 12th | 15.2 |
| 13th | 9.09 |
| 14th | 6.06 |
| 15th | 3.03 |
| 16th | 0 |
tournament.csv
To get the points for each team/tournament season you can multiply the teams initial seed (1 - 16) by the assigned points as defined in the above table of 100 - 0.
| variable | class | description |
|---|---|---|
| year | double | Tournament year |
| school | character | School name |
| seed | double | Seed rank |
| conference | character | Conference name |
| conf_w | double | Conference wins |
| conf_l | double | Conference losses |
| conf_percent | double | Conference win/loss percent |
| conf_place | character | Conference placement (ie, 1st, 2nd, etc) |
| reg_w | double | Regular season wins |
| reg_l | double | Regular season losses |
| reg_percent | double | Regular season win/loss percent |
| how_qual | character | How qualified - Whether the school qualified with an automatic bid (by winning its conference or conference tournament) or an at-large bid |
| x1st_game_at_home | character | Whether the school played its first-round tournament games on its home court. |
| tourney_w | double | Tournament wins |
| tourney_l | double | Tournament games losses |
| tourney_finish | character | Tournament finish - The round of the final game for each team. OR=opening-round loss (1983 only); 1st=first-round loss; 2nd=second-round loss; RSF=loss in the Sweet 16; RF=loss in the Elite Eight; NSF=loss in the national semifinals; N2nd=national runner-up; Champ=national champions |
| full_w | double | Total sum of wins |
| full_l | double | Total sum of losses |
| full_percent | double | Total sum win/loss percent |
Cleaning Script
library(tidyverse)

raw_df <- read_csv("https://raw.githubusercontent.com/fivethirtyeight/data/master/ncaa-womens-basketball-tournament/ncaa-womens-basketball-tournament-history.csv")

clean_tourn <- raw_df %>%
  janitor::clean_names() %>%
  mutate(across(c(seed, conf_w:conf_percent, full_percent), parse_number))

clean_tourn %>%
  write_csv("2020/2020-10-06/tournament.csv")